60 YEARS OF POMC: From the prohormone theory to pro-opiomelanocortin and to proprotein convertases (PCSK1 to PCSK9)
-
Figure 3
Sequence of β-LPH. Residues are indicated in color-coded circles. Those that were targeted for cleavage to generate smaller peptides for sequencing (Arg and Lys for trypsin digestion; Met for cyanogen bromide treatment) are presented in circles with wiggly borders. The pairs of basic residues flanking the sequences of β-MSH are boxed. (Data from Chrétien & Li 1967 and corrected by addition of Ile83).
-
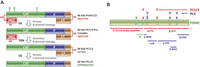 Figure 5
(A) Biosynthesis of PC1/3. The cascade of proteolytic maturation and activation of the zymogen starts in the ER, and continues in the trans-Golgi network (TGN) and in secretory granules (SG). (B) PC1/3 and PC2 preferred cleavage sites in POMC polypeptide. The sites and the major processing are indicated by color-coded (red for PC1/3 and blue for PC2) arrowheads and lines, respectively.
-
Figure 6
LDL-C concentration in carriers and noncarriers of Q152H PCSK9 mutation in three French-Canadian families. The mutation is associated with a 37% reduction of mean plasma LDL-C or ∼1 mmol/L (P<0.001). Carriers included homozygotes (−/−) and heterozygotes (+/−) for the mutation. Their plasma LDL-C ranged from 0.5 to 3.2 mmol/L (95% CI 1.53–2.08 mmol/L), whereas that of noncarriers (+/+) ranged from 1.2 to 4.7 mmol/L (95% CI 2.39–3.32 mmol/L). Error bars represent mean±S.D., group difference determined by 2-tailed nonparametric t-test.
-
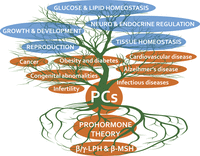 Figure 7
Ramifications of the relevance of proprotein convertases for the biology of health and disease. At the root of it all are the three POMC peptides and the theory that was deduced from their sequences.
- © 2016 Society for Endocrinology