E2F1-mediated human POMC expression in ectopic Cushing’s syndrome
- Takako Araki*,
- Ning-Ai Liu*,
- Yukiko Tone,
- Daniel Cuevas-Ramos,
- Roy Heltsley,
- Masahide Tone and
- Shlomo Melmed⇑
- Correspondence should be addressed to S Melmed; Email: melmed{at}csmc.edu
-
Figure 1
hPOMC promoter activity in ectopic Cushing’s cell lines. (A) POMC expression in lung (DMS79) and colon (COLO320) cancer cell lines were analyzed by RT-PCR and compared with those in normal lung (BEAS-2B) and normal colon (hNCC) cells. Expression levels were normalized with 18S rRNA. (B, C) Primary cultures of cells from five human ectopic ACTH producing tumors (#1, #4, #5 lung; #2 liver; #3 thymus) treated with or without R-roscovitine for 48 h. POMC mRNA were measured by RT-PCR (B) and medium ACTH concentrations in primary cultures were measured by RIA (normalized for viable cell numbers; n = 5 tumors, mean ± s.e.) (C). (D) POMC mRNA levels were analyzed by RT-PCR using RNA derived from DMS79 and COLO320 cells treated with or without indicated doses of R-roscovitine. POMC protein levels in derived whole cell extracts were also analyzed by immunoblotting with anti-POMC. (E) POMC, Tpit, Pitx1, and NeuroD1 expression in pituitary Cushing’s tumor, ectopic Cushing’s tumors (lung, thymus, and liver), and DMS79 cells were analyzed by RT-PCR. (F) Structure of point mutated luciferase reporter plasmids of the rPomc promoter (−480/+63) (left). Luciferase assays performed using point mutations in AtT20 cells (right) were compared with those generated using negative control plasmid basic (no promoter). (G) Structure of point mutated luciferase reporter plasmids of the hPOMC promoter (−428/+68) (left). Luciferase assays performed using point mutants in DMS79 cells and COLO320 cells (right) were compared with those generated using negative control plasmid basic (no promoter). Luciferase (F, G) and RT-PCR (A, B, D) results are representative of four independent experiments, RIA was performed in duplicate tubes; values are mean ± s.e. (C), and immunoblotting results are representative of three independent experiments (D).
-
Figure 2
Nuclear factor binding to the proximal hPOMC promoter (−42 to +68). (A) Structures of luciferase reporter plasmids using human POMC promoter 5′-deletion mutants. Positions of 5′-ends are indicated (all deletion mutants contain the same 3′-end, +68). Luciferase assays using 5′ deletion mutants in DMS79 cells (right), and activities compared with negative control plasmid basic (no promoter). (B) hPOMC DNA sequence (−52/+76). The transcription start site is defined as position +1. Minimal promoter plasmids contain five direct repeat copies of the indicated fragments (#1 to #7) and oligonucleotide orientation is indicated by an arrow (direct repeat). (C) Luciferase assays in DMS79 cells using minimal promoter plasmids shown in B, compared with mini-Pro (no inserted fragment). (D) EMSA performed using probes #5, #6, mutant probe #6, and #7 in DMS79 cells. The mutated sequence in probe #6 is shown in bold. The three upper bands are indicated by * (the top thick band consists of two bands) and the common band from probes #5 and #6 is indicated by the arrow. (E) Super-shift EMSA was performed using probe #6 with nuclear extracts from DMS79 cells, and anti-Sp1, and anti-Sp3. Positions of Sp1 and two different Sp3 sizes are shown. (F) EMSA was performed with Wt and M1-6 probes with nuclear extracts from DMS79 cells. Mutant sequences are in bold; bands are shown under the probe sequences. (G) Luciferase assays were performed in DMS79 cells using the indicated reporter plasmids. Inserted fragments (five direct repeat copies) are shown, and mutated sequences (shown in F) are indicated by ×. Luciferase activities were compared with those without inserted fragment. EMSA results are representative of three independent experiments (D, E, F) and luciferase results are representative of four independent experiments, each depicted as mean ± s.e. of triplicate samples (A, C, G).
-
Figure 3
E2F1 binding to the hPOMC promoter. (A) Results of EMSA performed with indicated probes and consensus competitors. No competitor is indicated by -. (B) EMSA and supershift-EMSA were performed with nuclear extracts prepared from DMS79 cells using probe #5, E2F consensus competitor, and indicated antibodies to E2F molecules. (C) Results of luciferase assays performed using the indicated reporter plasmids constructed with hPOMC promoter fragments (#5, #6, and #7) and the minimal promoter shown in Fig. 2B. Reporter plasmids were co-transfected with E2F1 or E2F3 expression plasmids or negative control empty vector (Vector). (D, E, F) ChIP assays were performed with anti-E2F1 (E2F1), anti-acetyl histone H4 (AcH4), or negative control (IgG) using primer sets shown in D (a, b, c). The analyzed ChIP regions are from DMS79 (E) and COLO320 cells (F). EMSA and ChIP results are each representative of triplicate independent experiments (A, B, E, F) and luciferase results are representative of four independent experiments, each depicted as mean ± s.e. of triplicate samples (C).
-
Figure 4
E2F1-mediated hPOMC transcription in ectopic Cushing’s tumor cells. (A) Results of luciferase assays performed in COLO320 cells using the −42 hPOMC promoter (−42/+68) reporter plasmid (Fig. 2A) or negative control basic (no promoter). E2F1 and/or DP1 expression plasmids were co-transfected, and total DNA abundance adjusted with empty vector. (B) POMC and PTH mRNA levels were analyzed by RT-PCR using RNA derived from COLO320 cells transfected with E2F1 and/or DP1 expression plasmids. (C) Luciferase assays were performed using the −42 hPOMC promoter in DMS79 cells as described in A. (D) POMC mRNA levels were analyzed in DMS79 cells as described in B. (E) Immunoblotting of protein extracts derived from DMS79 cells transfected with control siRNA (control) or E2F1 siRNA. E2F1, POMC, and PTH expression measured by RT-PCR of cDNA derived from DMS79 cells transfected with control siRNA (control) or E2F1 siRNA. Expression levels were normalized with 18S rRNA. (F) POMC and E2F1 mRNA levels were analyzed by RT-PCR using human lung carcinoid tumors. Expression levels were normalized with 18S rRNA. Immunoblotting, RT-PCR, and luciferase results are representative of three independent experiments (A, B, C, D, E, F), each depicted as mean ± s.e. of triplicate samples (A, B, C, D, E).
-
Figure 5
hPOMC is suppressed by R-roscovitine treatment through E2F1 DNA binding. (A) Luciferase assays were performed using −42 hPOMC promoter in DMS79 cells treated with (+) or without (−) R-roscovitine at the indicated concentrations, and luciferase activities compared to negative control plasmid basic (no promoter). (B) Luciferase assays using the minimal promoter (Fig. 2B) were performed in DMS79 cells treated with (+) or without (−) R-roscovitine at the indicated concentrations. (C) Results of EMSA performed using indicated probes (#1 through #5, shown in Fig. 2B) with nuclear extracts derived from DMS79 cells treated with (+) or without (−) R-roscovitine (50 µM). (D) ChIP assays were performed with anti-E2F1 (E2F1), anti-acetyl histone H4 (AcH4), or negative control (IgG) using the primers −46/+233 (Fig. 3D). Analyzed ChIP regions from R-roscovitine (50 µM) treated (Ros+) or non-treated (Ros−) DMS79 cells and COLO320 cells are shown. Luciferase results are representative of four independent experiments (A, B), EMSA results are representative of three independent experiments (C), and ChIP assays results are representative of three independent experiments (D).
-
Figure 6
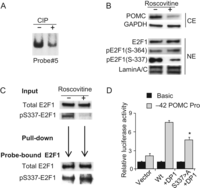
E2F1 phosphorylation is required for E2F1 binding to the hPOMC promoter. (A) Results of EMSA performed using probe #5 and nuclear extracts treated with CIP (+) or control nuclear extracts (−) incubated with CIP and CIP inhibitor (see ‘Methods’ section). The E2F1 complex band is shown. (B) Immunoblotting using indicated antibodies (anti-POMC, anti-GAPDH, anti-E2F1, anti-pE2F1-Ser364, anti-pE2F1-Ser337, and anti-Lamin A/C) performed using whole cell (CE) or nuclear (NE) extracts derived from DMS79 cells treated with (+) or without (−) R-roscovitine (50 µM). (C) Results of immunoblotting using anti-total E2F1 and anti-pSer337-E2F1 performed with nuclear extracts (input) derived from DMS79 cells treated with (+) or without (−) R-roscovitine (50 µM). Nuclear extracts from R-roscovitine treated cells were used for DNA pull-down assay, and proteins precipitated with biotinylated probe containing E2F1 binding sites (−24/+50) (shown in Fig. 2B) were analyzed by anti-total E2F1 and anti-pSer337-E2F1. (D) Results of luciferase assays performed in COLO320 cells using the −42 hPOMC promoter (−42/+68) reporter plasmid or negative control. Wild type E2F1 or S337 > A E2F1 and DP1 expression plasmids were co-transfected, and total DNA abundance adjusted with empty vector. EMSA, immunoblotting, pull-down assay, and luciferase assay results are representative of three independent experiments (A, B, C, D).
-
Figure 7
E2F1 inhibitors HLM006474 suppress hPOMC expression. (A, B, C) DMS79 cells were treated with HLM006474 at the indicated concentrations and hPOMC (A) and hPTH (B) mRNA levels analyzed by RT-PCR. Expression levels are normalized with 18S rRNA. Immunoblotting using indicated antibodies (anti-POMC, anti-E2F1, anti-pE2F1-Ser337, and anti-GAPDH) was performed using protein extracts derived from DMS79 cells treated with HLM006474 at indicated concentrations (C). (D) Primary cultures derived from non-pituitary ACTH secreting tumors (#1, 2, 3) treated with HLM006474. hPOMC and hPTH mRNA levels were analyzed by RT-PCR and normalized with 18S rRNA. RT-PCR results from DMS79 cells are representative of four independent experiments and are depicted as mean ± s.e. of triplicate samples (A, B). For patient samples, RT-PCR and immunoblotting were performed in triplicate.
- © 2016 Society for Endocrinology


